Fundamental Analysis Explained

Investing in the stock market can often feel like navigating a complex maze, which is where Fundamental Analysis comes into play. This method provides investors with a robust framework for assessing a company’s intrinsic value by examining various key components. In this blog post, we will delve into the essential elements of fundamental analysis, from the intricacies of financial statements to the impact of economic indicators. Additionally, we’ll explore different valuation methods, highlight common pitfalls to avoid, and offer practical tips for applying these principles to enhance your investment strategy. Whether you’re a seasoned investor or just starting your journey, understanding fundamental analysis is crucial for making informed decisions in today’s dynamic market.
What is Fundamental Analysis?
Fundamental Analysis is a crucial method used by investors to evaluate the intrinsic value of a security. It examines various economic, financial, and other qualitative and quantitative factors. By understanding the underlying health of a company, investors can make informed decisions.
Key Aspects of Fundamental Analysis:
- Objective: To determine whether a stock is undervalued or overvalued compared to its current market price.
- Focus Areas:
- Company financial health
- Industry conditions
- Economic environment
| Aspect | Description |
|---|---|
| Earnings | Analyzing profit margins and revenue sources. |
| Balance Sheet | Evaluating assets, liabilities, and equity. |
| Cash Flow | Understanding operational efficiency and liquidity. |
| Growth Potential | Assessing future growth prospects and strategy. |
By leveraging Fundamental Analysis, investors can identify solid investment opportunities while minimizing risks associated with market volatility.
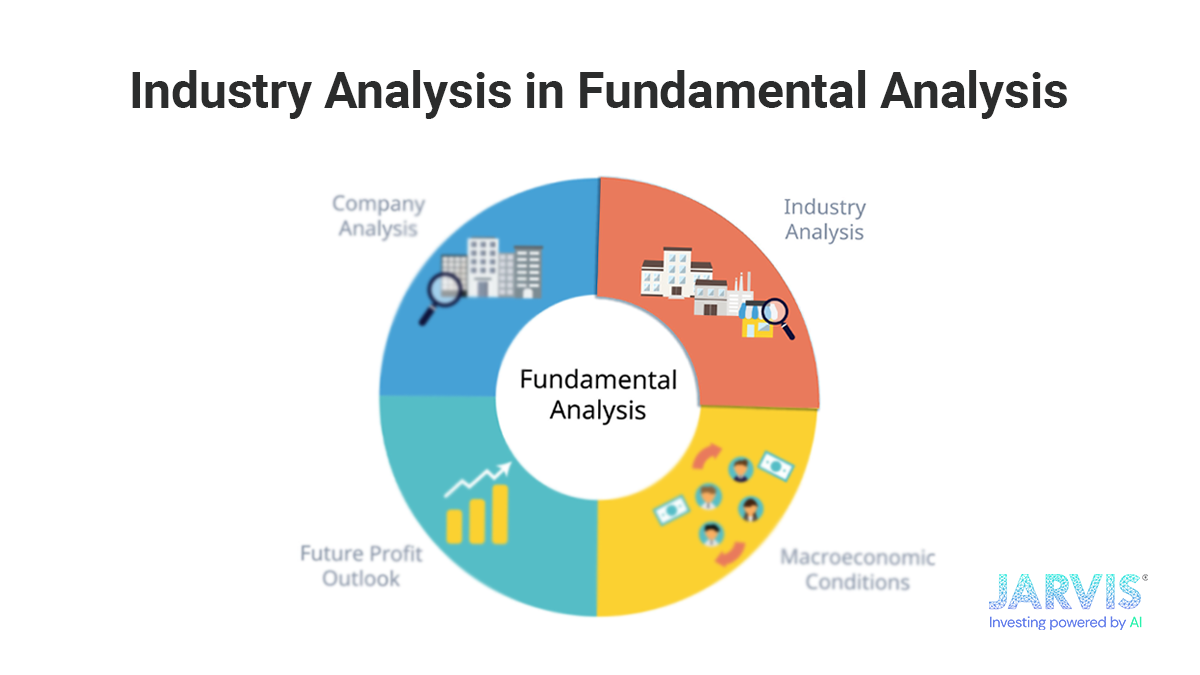
Key Components of Fundamental Analysis
Understanding the Fundamental Analysis involves several key components that investors must grasp to make informed decisions. Here are some essential elements to consider:
| Component | Description |
|---|---|
| Financial Statements | These documents provide insights into a company’s financial health, including income statements, balance sheets, and cash flow statements. |
| Economic Indicators | Indicators such as GDP growth rates, unemployment figures, and inflation rates help gauge overall economic health, influencing investment decisions. |
| Valuation Metrics | Ratios like Price-to-Earnings (P/E), Price-to-Book (P/B), and dividend yield are crucial for determining if a stock is over- or undervalued. |
| Industry Analysis | Understanding the industry dynamics, including competition and regulatory factors, can highlight potential challenges and opportunities. |
| Market Conditions | Economic cycles and market sentiment can significantly impact asset prices, making it essential to consider current trends. |
By focusing on these components, investors can perform a thorough Fundamental Analysis and enhance their investment strategies effectively. Each component offers valuable insights that, when analyzed together, create a comprehensive picture of the investment landscape.
Understanding Financial Statements
Financial statements are essential tools in the field of Fundamental Analysis, as they provide a snapshot of a company’s financial health. The three primary types of financial statements include the income statement, balance sheet, and cash flow statement.
| Financial Statement | Description | Key Metrics |
|---|---|---|
| Income Statement | Displays revenue, expenses, and profit over a specific period | Net income, Earnings per Share (EPS) |
| Balance Sheet | Shows assets, liabilities, and equity at a specific time | Current ratio, Debt-to-equity ratio |
| Cash Flow Statement | Reveals cash inflows and outflows over a time period | Operating cash flow, Free cash flow |
Using these statements, investors can evaluate a company’s profitability, liquidity, and overall stability. Moreover, analyzing trends in these reports enables investors to make informed decisions about potential investments. By understanding the relationships between these documents, one can paint a clearer picture of a company’s operational efficiency and future growth prospects.
The Role of Economic Indicators
Economic indicators play a crucial role in Fundamental Analysis, providing valuable insights into the overall health of an economy. By evaluating these indicators, investors can make informed decisions about potential investments. Here are some key types of economic indicators and their significance:
| Indicator | Description | Importance |
|---|---|---|
| Gross Domestic Product (GDP) | Measures the total economic output of a country. | Indicates economic growth or recession. |
| Unemployment Rate | Represents the percentage of the workforce that is jobless. | Higher rates can signal economic distress. |
| Inflation Rate | Measures the rate at which prices for goods and services rise. | Affects purchasing power and interest rates. |
| Consumer Confidence Index | Gauges how optimistic consumers are about the economy’s future. | High confidence can stimulate spending and investment. |
| Interest Rates | The cost of borrowing money, set by a country’s central bank. | Influences consumer spending and business investment. |
Understanding these indicators allows investors to assess market conditions accurately. By integrating economic data alongside company-specific metrics, investors can enhance their Fundamental Analysis, ultimately leading to better investment choices.

Valuation Methods in Fundamental Analysis
Valuation methods are crucial in Fundamental Analysis as they help investors determine a stock’s intrinsic value. Here are some key valuation methods commonly used:
| Valuation Method | Description |
|---|---|
| Discounted Cash Flow | This method estimates the present value of expected future cash flows, providing a comprehensive view of value over time. |
| Price-to-Earnings (P/E) | A popular ratio that compares the company’s current share price to its earnings per share, helping to assess whether the stock is over or under-valued. |
| Price-to-Book (P/B) | This ratio evaluates a company’s market value against its book value, assisting in identifying potential undervalued stocks. |
| Dividend Discount Model (DDM) | Focused on dividend-paying stocks, this model calculates the present value of expected future dividends, offering insights into long-term investment potential. |
Employing these methods effectively can enhance an investor’s ability to make informed decisions, maximizing potential returns while minimizing risks.
Common Mistakes in Fundamental Analysis
Navigating the world of Fundamental Analysis can be complex, and it’s easy for investors to make mistakes. Here are some common pitfalls to avoid:
- Over-reliance on Historical Data: Investors often focus too much on past performance without considering future market conditions. This can lead to misguided forecasts.
- Ignoring Market Sentiment: Some analysts neglect the impact of market psychology, which can affect stock prices significantly.
- Misinterpreting Financial Ratios: Ratios are useful, but relying solely on them without context can result in uninformed decisions.
- Failing to Diversify: A common error is concentrating investments in a few stocks based solely on analysis, disregarding diversification to mitigate risk.
- Disregarding Economic Indicators: Economic conditions play a crucial role in a company’s performance. Ignoring these can distort your Fundamental Analysis outcomes.
By being aware of these common mistakes, you can refine your approach and improve your investment strategies significantly.
How to Apply Fundamental Analysis in Investing
Applying Fundamental Analysis in your investment strategy is crucial for making informed decisions. Follow these steps to effectively integrate this approach into your investing routine:
- Identify Investment Objectives: Define your goals, risk tolerance, and investment horizon beforehand. Knowing what you want helps tailor your analysis.
- Conduct Thorough Research: Assess a company’s fundamentals, which includes:
- Financial Statements: Income statements, balance sheets, cash flow statements.
- Economic Indicators: GDP growth, inflation rates, and employment statistics.
| Component | Importance |
|---|---|
| Earnings Per Share (EPS) | Indicates profitability |
| Price-to-Earnings (P/E) Ratio | Assesses valuation |
| Debt-to-Equity Ratio | Gauges financial leverage |
- Valuation Methods: Utilize various techniques, such as Discounted Cash Flow (DCF) and Dividend Discount Model (DDM), to estimate a stock’s intrinsic value.
- Keep Updated on Market Trends: Monitor industry news and economic changes that may impact your investments.
- Diversify Your Portfolio: Don’t put all your eggs in one basket—mix different asset classes to spread risk.
By following these guidelines, you’ll enhance your investment strategy and better leverage Fundamental Analysis for profitable outcomes.